
Abstracts der 54. DGN-Jahrestagung 2016
| Neuroonkologie und Lymphome: PET Vorsitz: T. Derlin, D. Hellwig 14:00 - 15:30 Hamburg 2 |
|
| V122 Treatment response evaluation using FET PET compared to MRI in glioblastoma patients at first recurrence treated with bevacizumab plus lomustine N. Galldiks1, V. Dunkl1, G. Stoffels2, C. P. Filss2, C. Tscherpel1, G. Ceccon1, I. Law3, M. Schmidt4, G. R. Fink1, N. J. Shah2, K. J. Langen2 1Uniklinik Köln, Klinik für Neurologie, Köln; 2Forschungszentrum Jülich, Institut für Neurowissenschaften und Medizin, Jülich; 3University of Copenhagen, Dept. of Clinical Physiology, Nuclear Medicine & PET, Copenhagen; 4Uniklinik Köln, Klinik für Nuklearmedizin, Köln | |
|
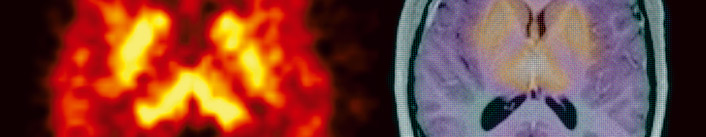
Ziel/Aim: We compared prospectively MRI response assessment with O-(2-18F-fluoroethyl)-L-tyrosine (FET) PET response evaluation during BEV/LOM treatment according to the BELOB trial in glioblastoma patients at first recurrence (Taal et al., 2014).Methodik/Methods: Glioblastoma patients at first recurrence after standard treatment (Stupp et al., 2005) were treated accordingly to the BELOB trial. Dynamic FET PET and MRI scans were performed at baseline and after 8-10 weeks. FET PET metabolic tumor volumes (MTV), maximum and mean tumor/brain ratios (TBRmax/mean) as well as dynamic FET PET parameters were obtained. The predictive ability of FET PET parameters and MRI on response assessment was evaluated with regard to PFS and OS after starting of treatment. Using ROC analyses, threshold values for FET PET parameter changes were obtained. MRI response assessment was based on RANO criteria (Wen et al., 2010). Subsequently, Kaplan-Meier survival analyses were performed to assess the predictive power for survival.Ergebnisse/Results: Twenty-three patients were included. Fifteen of 23 patients (age range, 34-75 ys.; MGMT promoter not methylated, 87%; IDH wild type, 100%) were eligible for data evaluation. Treatment response as assessed by MRI was not predictive for a significant longer PFS (P=0.23) and OS (P=0.07), respectively. In contrast, FET PET changes predicted a longer PFS (MTV decrease>25%, P=0.01; TBRmax decrease>12%, P=0.02) and OS (MTV decrease>10%, P=0.04), respectively. Interestingly, the absolute MTV at the first follow-up scan (threshold, 9 ml) provides the most significant prediction for PFS (P=0.006) as well as OS (P=0.003). However, both TBRmean and dynamic FET PET parameters were not predictive for treatment response.Schlussfolgerungen/Conclusions: FET PET appears to be helpful to identify responders to BEV/LOM early after initiation of treatment. | |